
Broad equity finished higher for the week, with the S&P 500 and the Nasdaq indices both reaching record highs.
- The S&P 500 was up for the week, gaining 1.95%
- The Dow Jones Industrial Average was up by 0.66%
- The Nasdaq Composite was up by 3.50%
- The 10-Year Treasury closed at 4.28%
The Manufacturing and Services Purchasing Managers’ Indexes (PMI) were released for the month of June. Readings from the previous five months for both industries had shown indications of being in expansion territory. The June reading for the manufacturing industry fell slightly below May’s reading of 51.7 at 51.6. Despite this drop, the sector continues to be in expansion territory.
Markets closed early on Wednesday due to Independence Day. Additionally, markets remained closed for the entirety of the day on Thursday and reopened for trading on Friday morning.
Rounding out the week, the U.S. Department of Labor released the number of initial jobless claims from the past week at 238,000, which was a 4,000 increase from the previous reading. Separately, the weekly U.S. Baker Hughes Total Rig Count measured an additional four active rigs compared to the previous week, depicting an increase in demand.

A Cooling Jobs Market Makes the Case for a September Cut
The U.S. Federal Reserve (the Fed) has a dual mandate: to achieve maximum employment and to maintain price stability. This past week, the Bureau of Labor Statistics released their jobs report for the month of June which gave some insights into the first mandate. The report showed the U.S. economy added more jobs (206,000) than was expected (200,000) for the month of June.
Perhaps more surprising was the fact that the May numbers were reduced significantly to 218,000 jobs added for the month compared to the initial 272,000 estimates, and that the unemployment rate unexpectedly rose to 4.1% compared to the 4% forecast. This was the highest level since October of 2021. Lately, markets have been trading on the belief that bad economic news is good news for financial markets, since a worsening economic picture could increase the Fed’s urgency to reduce interest rates sooner rather than later.

Some economists were bullish on the report with the chief economist at Goldman Sachs stating that “It’s a soft landing kind of report and does support the idea that [the Fed] will cut relatively soon, and we continue to think September is most likely.”
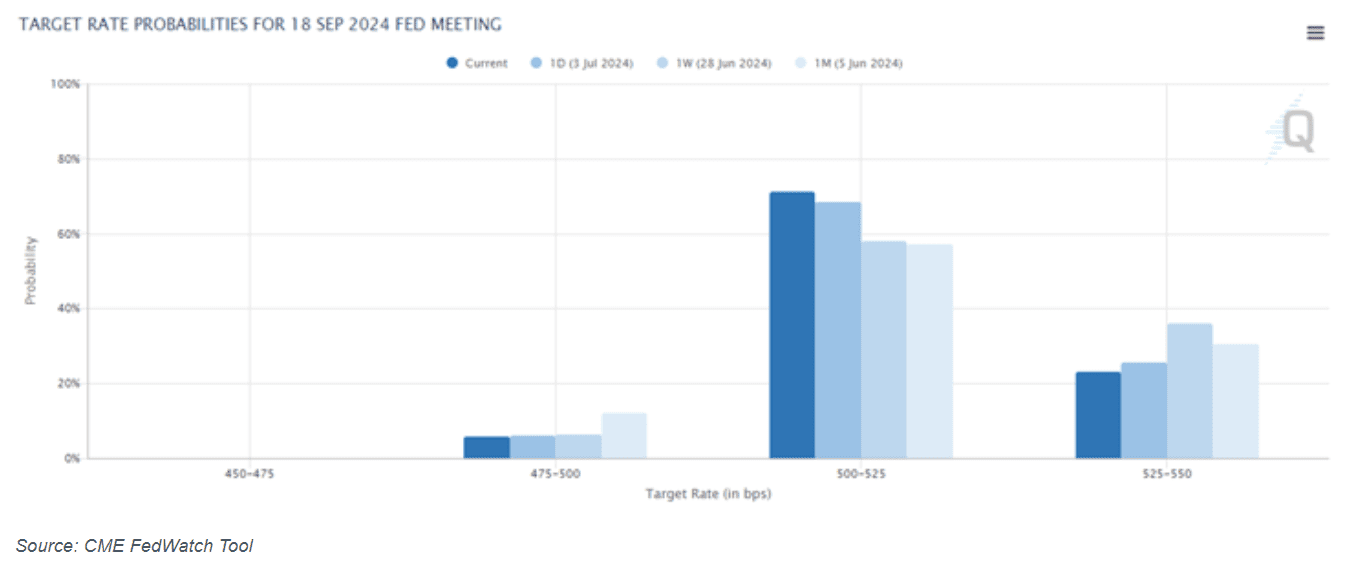
This sentiment seems to be the consensus in the market with the CME Group’s FedWatch Tool giving a rate cut a 76.9% probability as of Friday. This was relatively higher than a week prior which stood at around 64.1% probability of a rate cut.

This new data was received positively by the S&P 500 index which continues to reach new all-time highs. The same cannot be said of the Russell 2000 index which measures small capitalization companies in the United States and is often considered a better gauge of the overall economy. The index has been challenged by high interest rates and concerns about the direction of the economy. The labor report on Friday added fuel to those concerns with the index closing -0.49% lower on the day. As of the end of the first half of the year, the S&P 500 index had returned 15.3% for the year compared to 1.7% for the Russell 2000 index.
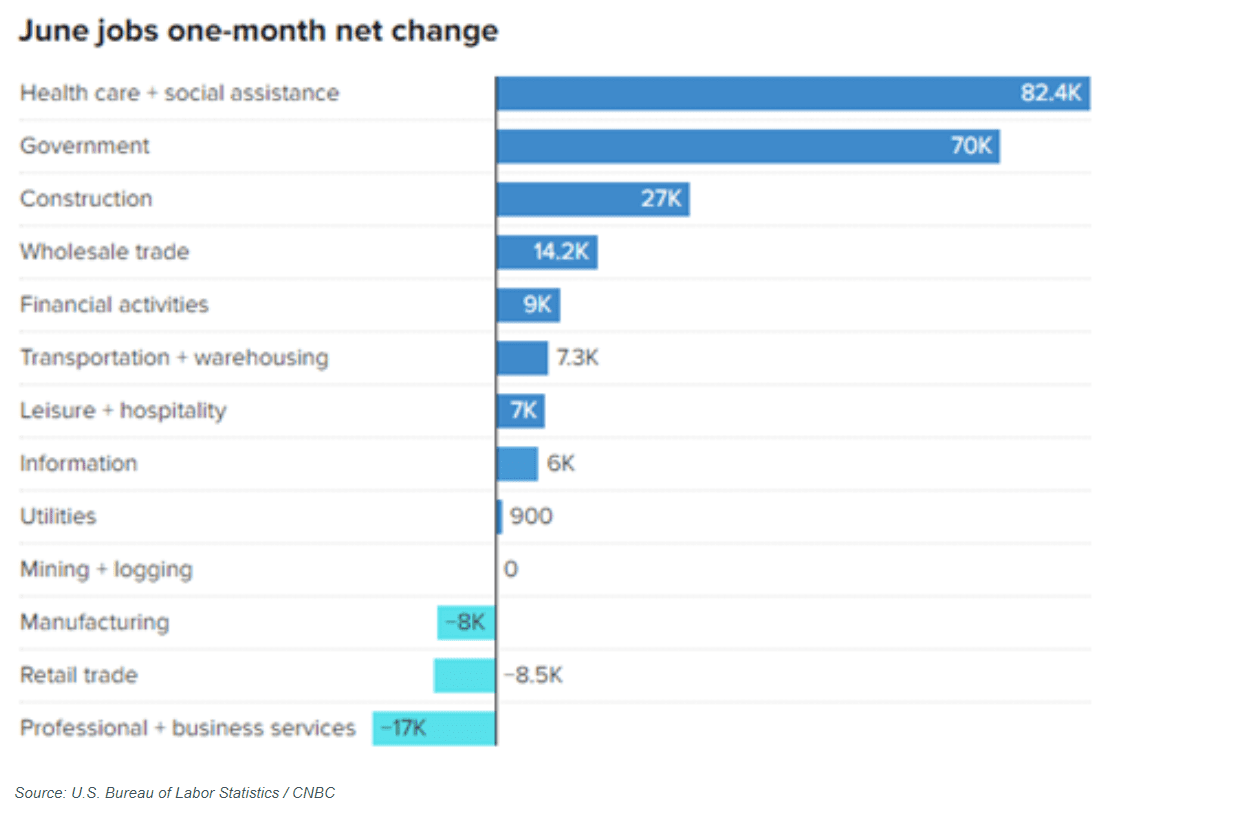
In terms of where the jobs were gained for the month of June, the data suggests that most of the jobs came from three industries: health care and social assistance, government, and construction.

Health care and social assistance have been a leader in the labor market recovery since the Covid-19 pandemic.

On Monday, consumer inflation expectations will be released. Inflation expectations have consistently stayed around 3% each month since January 2024. Economists will be watching to see if this trend continues.
Midway through the week, the Consumer Price Index (CPI) for the month of June will be released. Currently, June’s reading is forecasted to be the same as May’s reading of a 0.2% change. Additionally, the Producer Price Index (PPI) for the month of June will be released, measuring the change in input prices of raw, semi-finished, or finished goods and services. If PPI does increase, a portion of the increased input costs could be pushed onto consumers, making goods and services more expensive.
Later in the week, weekly continuing jobless claims will measure the number of unemployed people who continue to receive unemployment insurance benefits. Since the beginning of June, each week has increasingly measured more continuous unemployment claims compared to the previous reading. Economists will be watching to see if this trend continues. Furthermore, the University of Michigan will release their Consumer Expectations Index for the month of July, gauging consumers’ expectations of the economy.
This content was developed by Cambridge from sources believed to be reliable. This content is provided for informational purposes only and should not be construed or acted upon as individualized investment advice. It should not be considered a recommendation or solicitation. Information is subject to change. Any forward-looking statements are based on assumptions, may not materialize, and are subject to revision without notice. The information in this material is not intended as tax or legal advice.
Investing involves risk. Depending on the different types of investments there may be varying degrees of risk. Socially responsible investing does not guarantee any amount of success. Clients and prospective clients should be prepared to bear investment loss including loss of original principal. Indices mentioned are unmanaged and cannot be invested into directly. Past performance is not a guarantee of future results.
The Dow Jones Industrial Average (DJIA) is a price-weighted index composed of 30 widely traded blue-chip U.S. common stocks. The S&P 500 is a market-cap weighted index composed of the common stocks of 500 leading companies in leading industries of the U.S. economy. The NASDAQ Composite Index is a market-value weighted index of all common stocks listed on the NASDAQ stock exchange.
